eCommerce User Journey Intelligence: How to Read Your Analytics, Build a Revenue Roadmap, and Automate It All With Claude
Sector: Digital Commerce
Author: Nisarg Mehta
Date: 06/23/2026

Your GA4 dashboard, your Clarity recordings, your Hotjar surveys, and your Mixpanel funnels already contain the answer to your biggest revenue leak. The problem isn’t the data, it’s synthesis. This guide shows exactly how to read each tool, find high-confidence problems across sources, and use Claude to compress a 2–3 day manual analysis into under an hour, every month.
The Revenue Leak You Can't See
Here’s a hard truth: most eCommerce brands are sitting on a goldmine of behavioral data and doing almost nothing with it. Google Analytics dashboards get glanced at in Monday morning meetings. Hotjar recordings go unwatched for weeks. Mixpanel funnels get set up during a sprint and forgotten. The data isn’t the problem. The problem is that nobody has the time or the framework to connect it all into a clear picture of what’s actually happening, and what to do about it.
This guide changes that. You will learn exactly what “identifying the user journey” means in practice, what each analytics tool tells you, and what it doesn’t, how to read that data to find your biggest revenue leaks, and, crucially, how to use Claude AI to automate the entire analysis so you get a prioritized improvement roadmap every month without drowning in spreadsheets.
“Your analytics tools already contain the answers. The gap is synthesis, connecting dots across four different platforms to find the one problem worth fixing this week.”
— eCommerce User Journey Intelligence Framework
Most eCommerce teams treat their analytics stack as four separate departments that never talk to each other. GA4 lives in one tab, Clarity in another, Hotjar gets checked when someone remembers, and Mixpanel is set up once during onboarding and never revisited. The brands actually compounding their conversion rate over time are not the ones with more data, they are the ones who built a repeatable system for turning four disconnected dashboards into one prioritized list of what to fix next.
What "Identifying the User Journey" Actually Means
The user journey is every step a customer takes from the moment they first encounter your brand to the moment they buy, and everything that happens after. In eCommerce, this typically flows through six distinct stages, and understanding what happens at each one is the foundation everything else in this guide builds on.
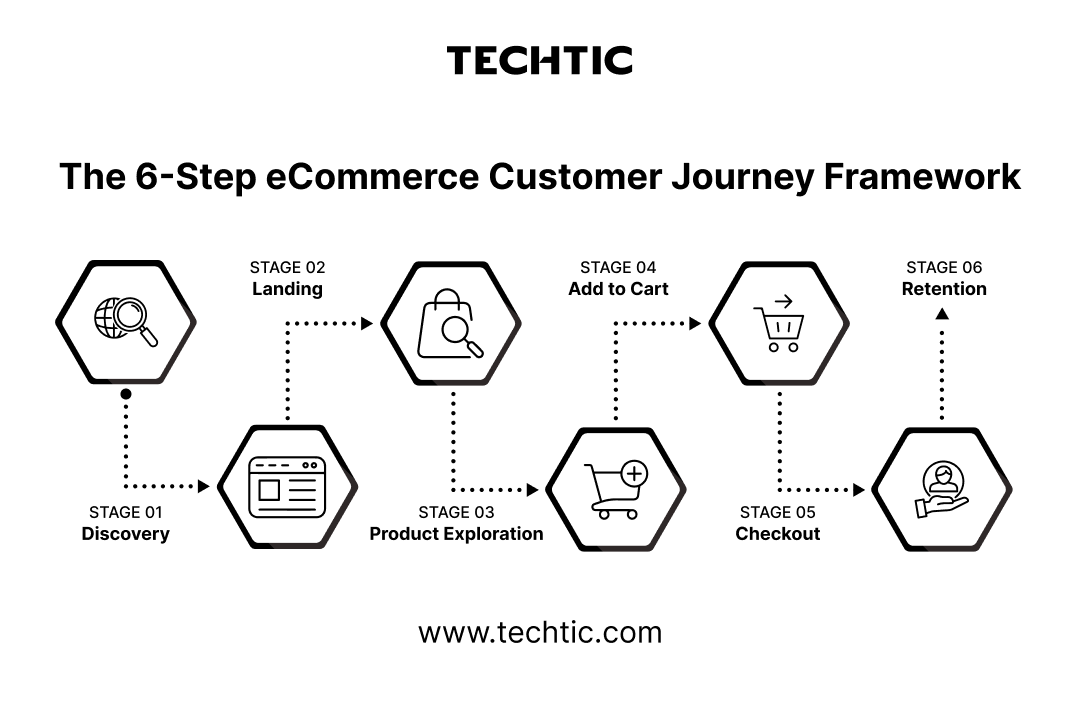
The first impression happens before they ever land on your site
The user sees an ad, a search result, a social post, or hears about you from a friend. Their intent and motivation at this point determines everything downstream. A shopper arriving from a discount-focused ad has different expectations than one arriving from an organic search for a specific product feature.
The first five seconds determine whether they stay
They arrive on your site. Does the page match what they expected from the ad? Is it fast? Is the value proposition clear? A mismatch between ad promise and landing page reality is one of the single highest-cost, lowest-visibility leaks in eCommerce, because the bounce happens silently, with no error message and no support ticket.
Trust is built or broken here, through imagery, copy, and pricing clarity
They browse. They search. They filter. They read product pages. This is the longest and most information-dense stage of the journey, and it is where most of the qualitative signal in your analytics stack actually lives, scroll depth, click patterns, and time spent all tell a story about what is and isn’t working.
A micro-conversion, and one of the highest-leverage gaps to close
They commit enough to add a product. The gap between product views and ATC is one of the highest-leverage gaps to close in the entire funnel, because every percentage point recovered here flows directly into checkout volume without requiring any additional traffic spend.
The moment of maximum intent, and maximum anxiety
Shipping costs, payment friction, trust signals, and form complexity all collide here. This is the single most analyzed and most consequential stage in eCommerce, because the customer has already done the hard work of deciding to buy, and the brand’s only remaining job is to not get in the way.
This is where genuinely profitable brands are built
Did they come back? Did they refer a friend? A 5% lift in retention can drive 25–95% more profit, a figure that surprises most founders who are still allocating the overwhelming majority of their budget toward new customer acquisition rather than the post-purchase experience.
Identifying the user journey means mapping this flow with real data: Where do people enter? Where do they exit? What do they click? What confuses them? What makes them trust you enough to buy? Every tool covered in the next section answers a different piece of that question, and no single one answers all of it.
The Four Tools Every eCommerce Brand Needs
No single tool gives you the full picture. Each tool answers a different type of question. Think of them as four different lenses on the same reality, and the magic happens not in any single lens, but in what becomes visible when you look through all four at once.
Google Analytics 4
GA4 answers the quantitative questions: How many? What percentage? Which channel? It tells you the scale of problems without telling you why they exist. GA4 is your single source of truth for traffic volume, conversion rates, revenue attribution, and funnel drop-off percentages.
What to derive from GA4
- Funnel conversion rates at each stage, segmented by device (mobile vs desktop) and traffic source
- Revenue by acquisition channel, which sources drive buyers vs browsers
- Top exit pages, any page with >40% exit rate on a key path needs investigation
- Cohort LTV analysis, which acquisition months produced your best long-term customers
- Path exploration, what users actually do after viewing a product page (spoiler: it’s usually not “add to cart”)
Microsoft Clarity
Clarity answers the qualitative questions: Where do they look? What do they click that shouldn’t be clicked? Where do they give up? It’s free, GDPR-compliant, and records every session. This is where you watch your customers struggle in real time, and it remains one of the most underused tools in the entire eCommerce analytics stack, largely because it requires actually watching recordings rather than glancing at a chart.
What to derive from Clarity
- Scroll depth on PDPs, if users don’t reach your reviews section, they’re not seeing your social proof
- Click heatmaps on product pages, is your Add to Cart button in the hot zone or ignored?
- Rage click sessions, users furiously clicking something that doesn’t work signals broken UI
- Dead click areas, elements users think are interactive but aren’t (a common design confusion signal)
- Checkout abandonment recordings, 20 recordings of users who abandoned checkout will teach you more than any survey
Hotjar
Hotjar combines behavioral data (heatmaps, recordings) with direct user feedback (surveys, polls). This is where you ask customers why, and get actual answers in their own words, rather than inferring intent purely from clickstream data, which can be suggestive but is rarely definitive on its own.
What to derive from Hotjar
- Exit-intent surveys on checkout pages: “What stopped you from completing your order?”
- Post-purchase NPS: segment by first-time vs repeat buyers to see where delight diverges
- PDP feedback polls: “Did you find all the information you needed?” Pages with >30% “No” responses need content work
- Incoming feedback widget: users voluntarily tell you what’s broken, confusing, or missing
Mixpanel
Mixpanel is built for event-level, user-level analysis. Where GA4 tracks pageviews, Mixpanel tracks actions. It’s the tool for retention curves, cohort comparison, A/B test significance, and understanding the behavioral differences between your best customers and your one-time buyers.
What to derive from Mixpanel
- Retention curves at Day 1, 7, 14, 30, and 60 post-purchase, find your “leaky bucket” point
- Event funnels for each major flow: search-to-PDP, filter-to-ATC, checkout steps
- RFM segmentation: Recency, Frequency, Monetary value, find your champions and your at-risk users
- Time-to-purchase: how long from first visit to conversion, segmented by channel
- A/B test result significance checker, never ship a variant below 95% confidence

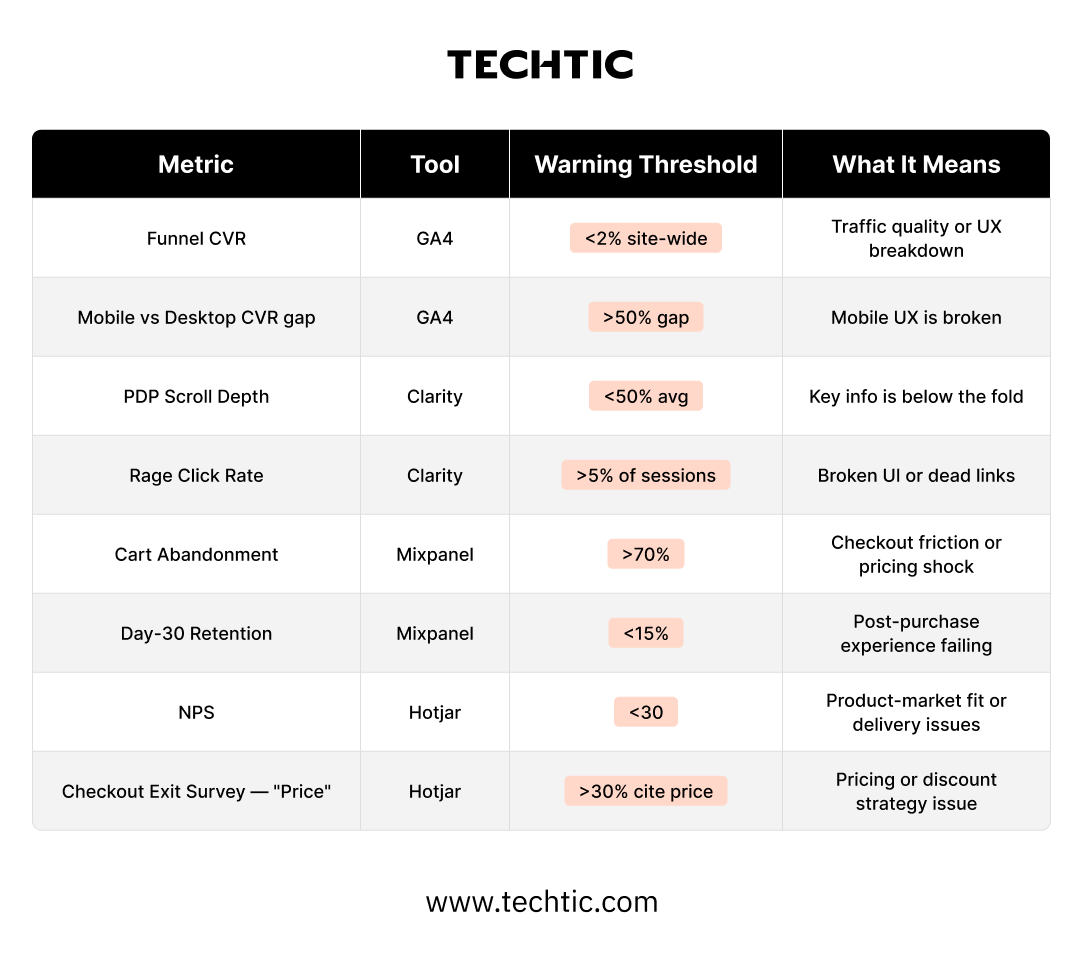
How to Read the Data: The Signal Hierarchy
Raw data is noise. You’re looking for signals. The most common mistake in eCommerce analytics is treating a single data point from a single tool as proof of a problem, when in reality, the confidence you should place in any finding depends entirely on whether it is corroborated elsewhere.
The Golden Rule of Analytics
A finding is only actionable when it appears in at least two independent sources. A high exit rate on a page (GA4) + rage clicks on that same page (Clarity) = high-confidence problem. A high exit rate alone = maybe it’s fine, or maybe you need more investigation.
The signal hierarchy works like this: Quantitative data (GA4, Mixpanel) tells you WHERE the problem is and HOW BIG it is. Qualitative data (Clarity recordings, Hotjar surveys) tells you WHY it’s happening. Voice of customer data (Hotjar surveys, NPS) tells you HOW CUSTOMERS FEEL about it. Each layer adds confidence and specificity to the layer before it.
The most valuable insight comes from corroboration. When GA4 shows 65% cart abandonment, Clarity shows rage clicks on the shipping cost calculator, and Hotjar surveys show “unexpected shipping costs” as the #1 abandonment reason, you have a high-confidence, clearly-evidenced problem with a clear solution direction. That triangulation is the entire point of running four tools instead of one.
The Complete Analysis Checklist
Run this checklist monthly. Every item feeds directly into your improvement roadmap. The discipline of running the same checklist every cycle, rather than an ad hoc review whenever someone remembers, is what turns analytics from a reactive exercise into a compounding one.
GA4 Analysis (Quantitative)
- Export funnel report from Discovery through Purchase, segmented by device and top 5 traffic sources
- Identify top 10 exit pages with highest exit rate. Flag any on key paths with >40%.
- Revenue attribution by channel, calculate effective ROAS if ad data is connected
- Run Path Exploration: what users do after a PDP view
- Device CVR comparison: mobile vs desktop. Identify the gap and its dollar value
- Cohort LTV report, 30/60/90 day revenue by acquisition month
Clarity Analysis (Behavioral)
- Review scroll depth on homepage, category pages, and top 10 PDPs
- Click heatmap on top 5 PDPs, is the ATC button in the click hot zone?
- Export rage-click sessions for top 5 high-traffic pages, watch 10+ recordings each
- Filter sessions: visited checkout, did not purchase. Watch 20 recordings
- Identify dead-click areas, what do users think is interactive?
- Check JS error sessions, cross-reference with exit rate on those pages
Hotjar Analysis (Voice of Customer)
- Active exit-intent survey on checkout page: one open-text question about abandonment reason
- Post-purchase NPS, target 200+ responses, segment first vs repeat buyers
- PDP feedback poll: “Did you find all the info you needed?” Flag pages with >30% No
- Export all feedback widget responses, tag by page type and theme
- Build Hotjar funnel to validate GA4 drop-off rates, compare both
Mixpanel Analysis (Product & Retention)
- Build event funnels for each major user flow (search, browse, filter, purchase)
- Run retention curve: Day 1, 7, 14, 30, 60 by purchase cohort
- RFM segmentation: identify champions, at-risk, and churned user segments
- Validate any active A/B tests, check for statistical significance at 95%+
- Time-to-purchase analysis segmented by acquisition channel
Cross-Source Synthesis
- Align GA4 exit pages with Clarity rage-click data, overlap = highest priority
- Match Hotjar survey themes to Mixpanel funnel drop-off events
- Build a priority matrix: score each finding on Impact (1–10) and Evidence strength (1–10)
- Create 30/60/90 day improvement roadmap from top findings
- Document all current KPI baselines before shipping any changes
- Schedule next monthly analysis cycle
How to Automate This Entire Process With Claude
The checklist above is powerful. But doing it manually every month takes 2–3 days of analyst time. Here’s how to compress it to under an hour using Claude as your AI analytics engine, turning a process that most teams skip because of the time cost into a routine that takes less time than a single team meeting.
Phase 1 - Set up your data pipeline
Connect each tool to a consistent export format. The goal is to have four clean CSV files in a shared folder each week.
- GA4 → BigQuery (automated nightly export) or manual CSV from Explore reports
- Clarity → CSV export from the Dashboard
- Hotjar → CSV export from Responses and Recordings summary
- Mixpanel → CSV from Funnels and Retention reports
Name files consistently: ga4_YYYYMMDD.csv, clarity_YYYYMMDD.csv, hotjar_YYYYMMDD.csv, mixpanel_YYYYMMDD.csv. This naming convention lets Claude compare month-over-month automatically.
Phase 2 - Per-tool analysis prompts
Upload each CSV to Claude with a tool-specific prompt. Here’s the GA4 prompt as a template, adapt the same structure for each of the other three tools.
Claude Prompt — GA4 Analysis
You are an eCommerce CRO analyst. I’m giving you a GA4 funnel export CSV.
Analyze:
- Which funnel stage has the highest drop-off % and on which device?
- Which traffic channel has the lowest CVR despite high volume?
- Which pages have exit rate > 40%?
- What is the CVR trend over the last 4 weeks?
Output a ranked list of the top 5 problems with evidence from the data. Be specific, include page names, percentages, and trend direction.
Format:
| Rank | Problem | Evidence | Impact Estimate |
Adapt this prompt for each tool. For Clarity, ask Claude to analyze scroll depth patterns and rage-click clusters. For Hotjar, ask it to categorize open-text survey responses into themes. For Mixpanel, ask it to identify the steepest retention cliff and the highest-drop funnel step.
Phase 3 - Cross-source synthesis prompt
Once you have four per-tool analyses, paste them all into a single Claude conversation with this synthesis prompt, this is the step that converts four separate reports into one prioritized, evidence-backed list.
Claude Prompt — Cross-Source Synthesis
I have 4 analysis reports from different analytics tools. Synthesize them.
[GA4 Report]: {paste ga4 claude output}
[Clarity Report]: {paste clarity claude output}
[Hotjar Report]: {paste hotjar claude output}
[Mixpanel Report]: {paste mixpanel claude output}
Your job:
- Find patterns appearing in 2+ sources (highest confidence findings)
- Flag contradictions between tools and explain potential reasons
- Score each finding: Impact (1-10) x Evidence Strength (1-10)
- Output a prioritized table of top 10 issues
Format:
| Issue | Tools that flagged it | Impact | Evidence | Recommended Fix |
Phase 4 - Roadmap generation prompt
Turn the synthesized findings into an actionable roadmap, structured by effort and time horizon so your team knows exactly what to ship this sprint versus what to plan for next quarter.
Claude Prompt - Roadmap Generation
Based on this prioritized issue list, create a 90-day improvement roadmap.
Rules:
- 30-day: Changes requiring no dev work (copy, images, layout tweaks)
- 60-day: Front-end dev changes (1–3 day tasks)
- 90-day: Strategic changes (new features, redesigns, A/B tests)
For each item include:
- Hypothesis: ‘If we [change X], then [metric Y] will improve because [reason]’
- Success metric and how to measure it
- Effort estimate (S/M/L)
- Team owner (Design / Dev / Marketing / CRO)
Format as a structured roadmap table grouped by time horizon.
Phase 5 - Monthly recurring analysis
Once you have your four prompts dialed in, the monthly process becomes remarkably fast:
- Export CSVs from all four tools (30 minutes)
- Run each CSV through its Claude prompt (15 minutes)
- Paste outputs into the synthesis prompt (10 minutes)
- Generate updated roadmap with changelog vs last month (5 minutes)
Total time: under an hour, down from 2–3 days of manual analyst work.
“Pro tip – competitive intelligence layer: Add a fifth data source to your synthesis prompt: competitor analysis from SimilarWeb, public review mining from Trustpilot/G2, and your own customer service ticket themes. Ask Claude to identify gaps between what competitors do well and where your data shows weakness. This turns a CRO analysis into a strategic brief.”
— eCommerce User Journey Intelligence Framework
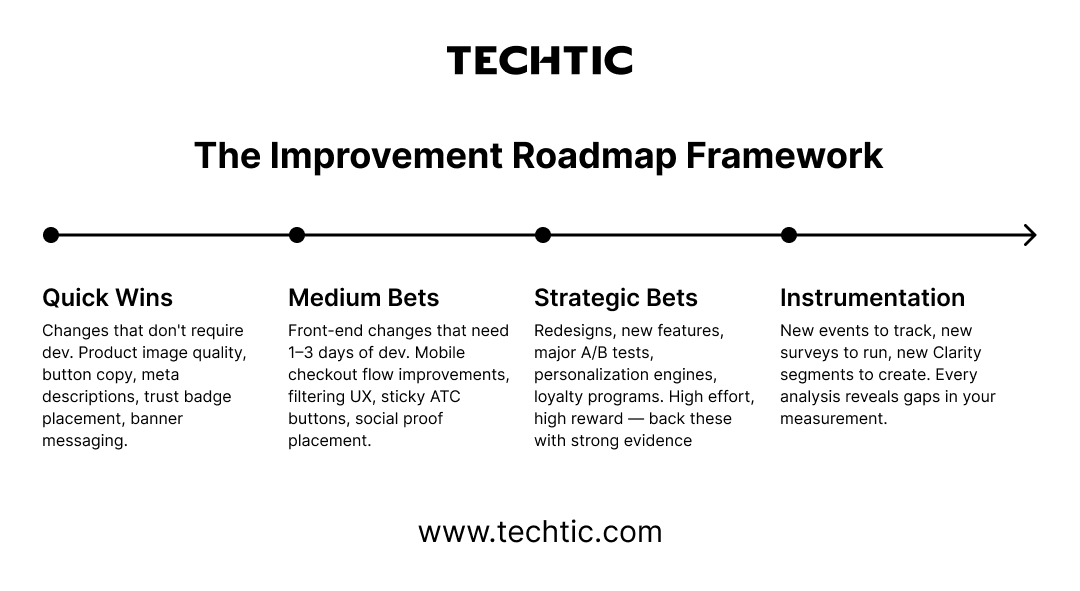
The Improvement Roadmap Framework
Every finding from your analysis maps to one of four categories. This prevents the common mistake of treating all insights as equal urgency, a mistake that leads teams to either ship low-impact quick fixes indefinitely or stall waiting for a “big redesign” that never gets prioritized.
The Compounding Advantage
Here’s what most eCommerce brands miss: analytics is a compounding practice. The first month of this process gives you a list of fixes. The third month gives you a validated list of what worked and what didn’t. The sixth month gives you a model of how your customers behave that’s accurate enough to predict impact before you build anything.
The brands winning in eCommerce right now aren’t necessarily spending more on ads or launching more products. They’re just making better decisions faster, because they have a systematic way to hear what their customers are silently telling them through every click, scroll, and abandoned cart.
“Every month you run this analysis, your confidence intervals shrink and your roadmap sharpens. By month six, you won’t be guessing what to build. You’ll know.”
— eCommerce User Journey Intelligence Framework
Your data is already talking. The question is whether you’re listening, and whether you have a fast enough system to act on what it says.

Your Data Is Already Talking
Every eCommerce brand has the raw material for this process sitting in their existing tools right now. The barrier has never been data availability, it has been the time and framework required to turn four disconnected dashboards into one clear answer about what to fix next. Claude removes that barrier by handling the synthesis work that used to require days of analyst time, leaving your team free to focus on what the data tells you to build rather than the labor of finding out.
The brands that build this monthly habit, export, analyze, synthesize, roadmap, ship, repeat, are not running a smarter one-time audit. They are building a compounding intelligence asset that gets sharper every cycle, while competitors are still treating analytics as a dashboard to glance at on Monday mornings.
FAQs
Q. What is eCommerce user journey analysis?
eCommerce user journey analysis is the process of tracking and understanding every interaction a customer has with your brand, from discovery to purchase and retention. It helps businesses identify friction points, improve conversion rates, and optimize the overall shopping experience.
Q. Which analytics tools are best for analyzing the eCommerce customer journey?
The best tools for eCommerce customer journey analysis include Google Analytics 4 (GA4), Microsoft Clarity, Hotjar, and Mixpanel. Together, these tools provide quantitative, behavioral, qualitative, and product analytics insights to uncover revenue opportunities.
Q. How can AI help automate eCommerce analytics?
AI tools like Claude can automate data analysis by synthesizing information from multiple analytics platforms, identifying patterns, prioritizing issues, and generating actionable improvement roadmaps that would otherwise take days to create manually.
Q. How do you identify revenue leaks in an eCommerce website?
Revenue leaks can be identified by analyzing funnel drop-offs, exit pages, rage clicks, abandoned carts, low scroll depth, customer feedback, and retention metrics. Cross-referencing insights from multiple analytics tools helps uncover high-confidence opportunities for improvement.
Q. How often should eCommerce brands perform analytics audits?
High-growth eCommerce brands should conduct a comprehensive analytics review every month. A monthly audit helps identify new friction points, measure optimization efforts, and build a data-driven growth roadmap.